BinaryCFI
The goal of this project is to instrument CFI protection to COTS binaries. Our work is focus on High Performance Computing applications particularly. The following contents are some useful notes collected during the development of this project.
How to run
- cd /BinaryCFI/test
- g++ -g -m64 test.c -o test -lstdc++
- g++ -m64 instru.c -fPIC -std=c++11 -shared -o libinstru.so
- sudo ln -s '/home/tao/BinaryCFI/test/libinstru.so' /usr/lib
- sudo ldconfig
- Run instrument.cpp
- objdump -d test-rewritten > disasm.txt
- objdump -R test-rewritten > disasmrel.txt
- Run disasmdyninst.cpp
- run disasm.py
- RErun instrument.cpp
- run test-rewritten
Torque
配置:--disable-gcc-warnings
cd /home/tao/Desktop/torque
./torque.setup root //配置
/etc/init.d/pbs_server restart //启动
qstat//查看状态
python '/home/tao/Desktop/test_overflow.py'
Commonds:
cd /home/tao/Desktop/test
g++ -c test.c
g++ -c -g -m64 test.c //include debug info
g++ -g -m64 test.c -o test -lstdc++ //include debug info,executable
g++ -m64 instru.c -fPIC -std=c++11 -shared -o libinstru.so
//将instrument要用的库加入系统库默认目录
sudo ln -s '/home/tao/BinaryCFI/test/libinstru.so' /usr/lib
sudo ldconfig
objdump -D test.o
objdump --section=.text -S test.o
objdump --section=.text -d -l test.o //compare with .c file
objdump -t -C test.o //symbol table
objdump -d test-rewritten > disasm.txt
readelf -S test 读取段表信息
用readelf -s 或 objdump -t 查看符号表
用readelf -S 或 objdump -h 查看段表
cd /home/tao/CLionProjects/cfg
./cfg /home/tao/Desktop/test/test
dot -Tpdf -ocfg.pdf '/home/tao/Desktop/cfg.dot'
32位版:加上 -m32 参数,生成32位的代码。
64位版:加上 -m64 参数,生成64位的代码。
debug版:加上 -g 参数,生成调试信息。
release版:加上 -static 参数,进行静态链接,使程序不再依赖动态库。加上 -O3 参数,进行最快速度优化。加上-DNDEBUG参数,定义NDEBUG宏,屏蔽断言。
GDB:
file test-rewritten
b *0x700173 7001bc
b *0x7001cb//设置断点
r //运行
c //继续运行到下一个断点
display /i \(pc //显示汇编命令
si // 执行一条汇编
set \)rax = 0x400a20
c //continuing run
i r rax //显示 rax的值
readelf -r test or objdump - R
.rela.dyn 需要重定位的变量列表 .rela.plt 需要重定位的函数列表
OS environment
For dyninstAPI, the environment variables DYNINSTAPI_RT_LIB and LD_LIBRARY_PATH need to be set appropriately. DYNINSTAPI_RT_LIB needs to be set to the path of the dyninst runtime library file (libdyninstAPI_RT.so.1) and the environment variable LD_LIBRARY_PATH needs to be updated so that it contains the directory containing the dyninst library (libdyninstAPI.so).
gedit /etc/environment (current user) or gedit /etc/profile (all users)
export DYNINSTAPI_RT_LIB="/usr/local/dyninst/lib/libdyninstAPI_RT.so"
source /etc/environment or source /etc/profile
程序的构成:
前面的答题很好了,但是不容易理解,简单点说:每个C程序的入口点_start处的代码用伪代码表示为_start: call __libc_init_first // 一些初始化 call _init call atexit call main call _exit从伪代码就看出来了,每个C程序都要在执行一些初始化函数后对main调用,若main末尾为return语句,那么控制返回,最终会call _exit,把控制返回系统。若省略return,那么也将会call exit。如果代码中有exit函数,那么会先执行atexit注册的函数,进而执行exit()把控制还给操作系统。总之,这些情况下,当main返回,控制会传给系统
used dyninst API
Expression::Ptr getControlFlowTarget() const
When called on an explicitly control-flow altering instruction, returns the non-fallthrough control flow destination. When called on any other instruction, returns NULL.
For direct absolute branch instructions, getControlFlowTarget will return an immediate value. For direct relative branch instructions, getControlFlowTarget will return the expression PC + offset. In the case of indirect branches and calls, it returns a dereference of a register (or possibly a dereference of a more complicated expression). In this case, data flow analysis will often allow the determination of the possible targets of the instruction. We do not do analysis beyond the single-instruction level in the Instruction API; if other code performs this type of analysis, it may update the information in the Dereference object using the setValue method in the Expression interface. More details about this may be found in Section 3.5 and Section 3.11.
Returns an Expression evaluating to the non-fallthrough control targets, if any, of this instruction.
Since you instrumented every basic block of a function, Dyninst would relocate the whole original function to another section. The relocated function would contain both the original code and the instrumentation code. Therefore, executing all the instructions at the patched sections would actually execute both your instrumentation and the original code. One reason to not jump back immediately after instrumentation is that executing two extra jumps for each basic block would significantly slow down the execution.
bool allowsFallThrough() const
Returns false if control flow will unconditionally go to the result of getControlFlowTarget after
executing this instruction.
virtual bool isCode(const Address)
Indicates whether the location is in a code region.
virtual bool isData(const Address)
Indicates whether the location is in a data region.
Hello Xiaozhu,

Thank you a lot for your response. I double-checked the gdb output,
and I suppose only one piece of instrumentation code is indeed executed.

In particular,
even tough basic blocks are instrumented like this (please see the
jmpq instructions):


But actually in the gdb debugging code only on one "addq" instruction is
indeed inserted..


Am I missed anything..?
You may want to take a look at the code coverage example, available here:
http://www.paradyn.org/html/tools/codecoverage.html
It's doing both function-level and block-level code coverage.
together in one section? IMHO,
as you don't have the relocation information in the disassembled output,
you actually cannot directly
"inline“ instrumentation code into the original code.. Could you please
elaborate a little bit?
This topic is covered at length in Drew Bernat's Anywhere, Anytime Binary Instrumentation paper:
ftp://ftp.cs.wisc.edu/paradyn/papers/Bernat11AWAT.pdf
The short version: if we parse the binary sufficiently accurately, and we are careful of what we know and what we don't know, we can relocate most code safely without compiler-level relocation information, and we can tell what's not safe to relocat. It's not easy, but it's not impossible either.
ASLR
Windows上的ASLR是一个链接时(link-time)选项,而在Linux上是一个编译时(compile-time)选项。在Windows上,代码在运行时因重定位才被patch。但在Linux与Unix的世界,该技术被称为text重定位。在Linux上,ASLR用不同的方式实现,除了在代码运行时patch,其在编译时就用某种方式使其地址无关。也就是说,可以将其加载到内存地址的任意位置,都可以正常运行。
ELF文件有三种类型:
可重定位的对象文件(Relocatable file): 由汇编器汇编生成的 .o 文件
可执行的对象文件(Executable file): 可执行应用程序
可被共享的对象文件(Shared object file): 动态库文件,也即 .so 文件
- .text section 里装载了可执行代码;
- .data section 里面装载了被初始化的数据;
- .bss section 里面装载了未被初始化的数据;
- 以 .rec 打头的 sections 里面装载了重定位条目;
- .symtab 或者 .dynsym section 里面装载了符号信息;
- .strtab 或者 .dynstr section 里面装载了字符串信息;
链接器在链接可执行文件或动态库的过程中,它会把来自不同可重定位对象文件中的相同名称的 section 合并起来构成同名的 section。接着,它又会把带有相同属性(比方都是只读并可加载的)的 section 都合并成所谓 segments(段)。segments 作为链接器的输出,常被称为输出section。我们开发者可以控制哪些不同.o文件的sections来最后合并构成不同名称的 segments。如何控制呢,就是通过 linker script 来指定。
一个单独的 segment 通常会包含几个不同的 sections,比方一个可被加载的、只读的segment 通常就会包括可执行代码section .text、只读的数据section .rodata以及给动态链接器使用的符号section .dymsym等等。section 是被链接器使用的,但是 segments 是被加载器所使用的。加载器会将所需要的 segment 加载到内存空间中运行。和用 sections header table 来指定一个可重定位文件中到底有哪些 sections 一样。在一个可执行文件或者动态库中,也需要有一种信息结构来指出包含有哪些 segments。这种信息结构就是 program header table
Read this link for details: http://www.cnblogs.com/xmphoenix/archive/2011/10/23/2221879.html
寄存器,Stack frame,calling convention
寄存器是CPU内部的元件,包括通用寄存器、专用寄存器和控制寄存器。
According to the ABI, the first 6 integer or pointer arguments to a function are passed in registers. The first is placed in rdi, the second in rsi, the third in rdx, and then rcx, r8 and r9. Only the 7th argument and onwards are passed on the stack.
There is a zone called red zone in the stack can be used by leaf-functions for x64.
Register rbp (base pointer register) may be omitted in x64. The AMD64 ABI introduced is making the base pointer explicitly optional. The gcc adheres to this recommendation and by default omits the frame pointer on x64, when compiling with optimizations.
"The conventional use of %rbp as a frame pointer for the stack frame may be avoided by using %rsp (the stack pointer) to index into the stack frame. This technique saves two instructions in the prologue and epilogue and makes one additional general-purpose register (%rbp) available."
Windows on x64 implements an ABI of its own, which is somewhat different from the AMD64 ABI.
See for details: http://eli.thegreenplace.net/2011/09/06/stack-frame-layout-on-x86-64
求栈地址用“leal指令”;求栈地址内的内容用“()”。“指针”其实就是地址。
leave指令(相当于movl %ebp, %esp 加popl %ebp的功能)
bss、data和rodata区别与联系:http://www.jianghaizhi.com/bckf/1248.html
Indirect call
An indirect branch is a branch where the branch is made to an address that is stored in a register or in a memory location. The operand of the branch instruction is the register or the memory location that stores the address to branch.
Whenever you see a memory operand that looks something like ds:0x00923030, that's a segment-relative addressing mode. The actual address being referred tp is at linear address 0x00923030 relative to the base address of the ds segment register.
Basically, x86 has a number of special segment registers: cs (code segment), ds (data segment), es, fs, gs, and ss (stack segment). Every memory access is associated with a certain segment register. Normally, you don't specify the segment register, and depending on how the memory is accessed, a default segment register is used. For example, the cs register is used for reading instructions.
汇编相关
$ 表示立即数
(rip) 表示寄存器对应内存
%rip 表示寄存器
RIP表示下一条指令地址
x86_64的指令长度是不定长的,不同指令所占空间长度不同
One of the larger (but often overlooked) changes to x64 with respect to x86 is that most instructions that previously only referenced data via absolute addressing can now reference data via RIP-relative addressing.
A special form of the mov instruction has been added for 64-bit immediate constants or constant addresses. **For all other instructions, immediate constants or constant addresses are still 32 bits. ** (这里对不对?需要验证!)
x86,plt中的entry用offset或者绝对地址找到GOP中的位置。offset是32bit长 see:https://docs.oracle.com/cd/E19683-01/817-3677/chapter6-1237/index.html。
readelf -r test or objdump - R
.rela.dyn 需要重定位的变量列表 .rela.plt 需要重定位的函数列表
Road map
1. Link-time relocation.
2. Load-time relocation:
There are two main approaches to solve this problem in Linux ELF shared libraries:
1.Load-time relocation. (不常用)
库文件中的地址皆为offset,load的时候把对应段的初始地址加上offset即是对应的物理地址。缺点:1.需要计算地址,速度慢。 2.不可重用。一个库load进内存之后,如果可以被其他程序复用,可以节省大量内存。3.这种情况下,text section 是 可写的,有完全隐患。
2.Position independent code (PIC) (主流)
对数据或者变量:这些相对地址存储在Global Offset Table (GOT)。函数引用got中的entry,这些entry指向数据段的参数或变量。GOT属于数据段,GOT中的entry的地址是绝对地址,根据 load-time relocation相同方法来计算。数据段可写危害性小,而且数据段是属于专有程序的。text段可以被不同程序共享。
对函数:Procedure Linkage Table (PLT) 存储在text段,plt不可写,里面存储的是相对地址。内含entry指向GOT对应的函数地址,又名trampoline。lazy模式。
A new addressing form, RIP-relative (relative instruction-pointer) addressing, is implemented in 64-bit mode. An effective address is formed by adding displacement to the 64-bit RIP of the next instruction.
Read http://eli.thegreenplace.net/tag/assembly.
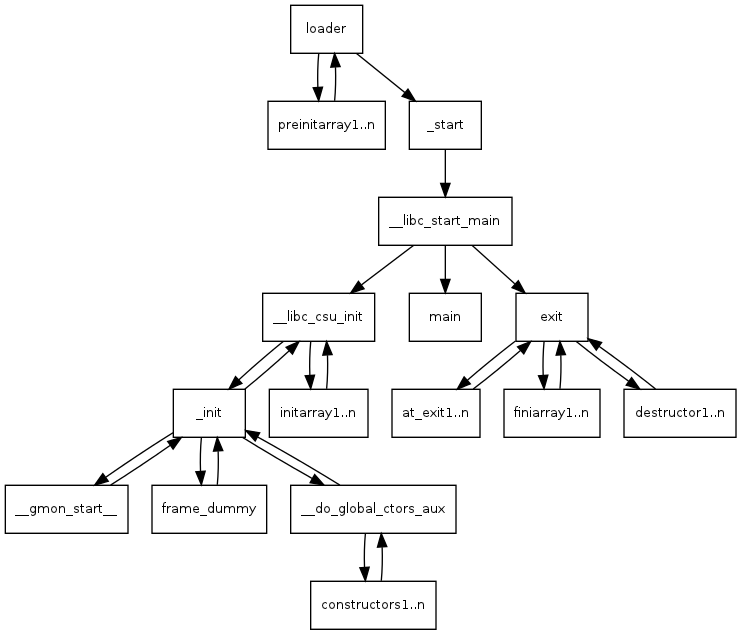
How the heck do we get to main()? read: http://dbp-consulting.com/tutorials/debugging/linuxProgramStartup.html
read code example: http://www.paradyn.org/html/tools/codecoverage.html
read: ftp://ftp.cs.wisc.edu/paradyn/papers/Bernat11AWAT.pdf
read: Acronyms relevant to Executable and Linkable Format (ELF) http://www.cs.stevens.edu/~jschauma/810/elf.html
scanf忘记加'&'危害有多大? 详解GOT表覆写攻击技术:
http://blog.csdn.net/smalosnail/article/details/53247502?_t_t_t=0.050024056468489064